Between the Numbers
A large non-profit was running multiple siloed workstreams to support COVID-19 vaccine roll-out on a global scale. The Between the Numbers initiative was established to bring together data and policy narrative to break down barriers and increase coordination of effort. A suite of data visualizations surfaced a variety of insights through an embedded web portal.
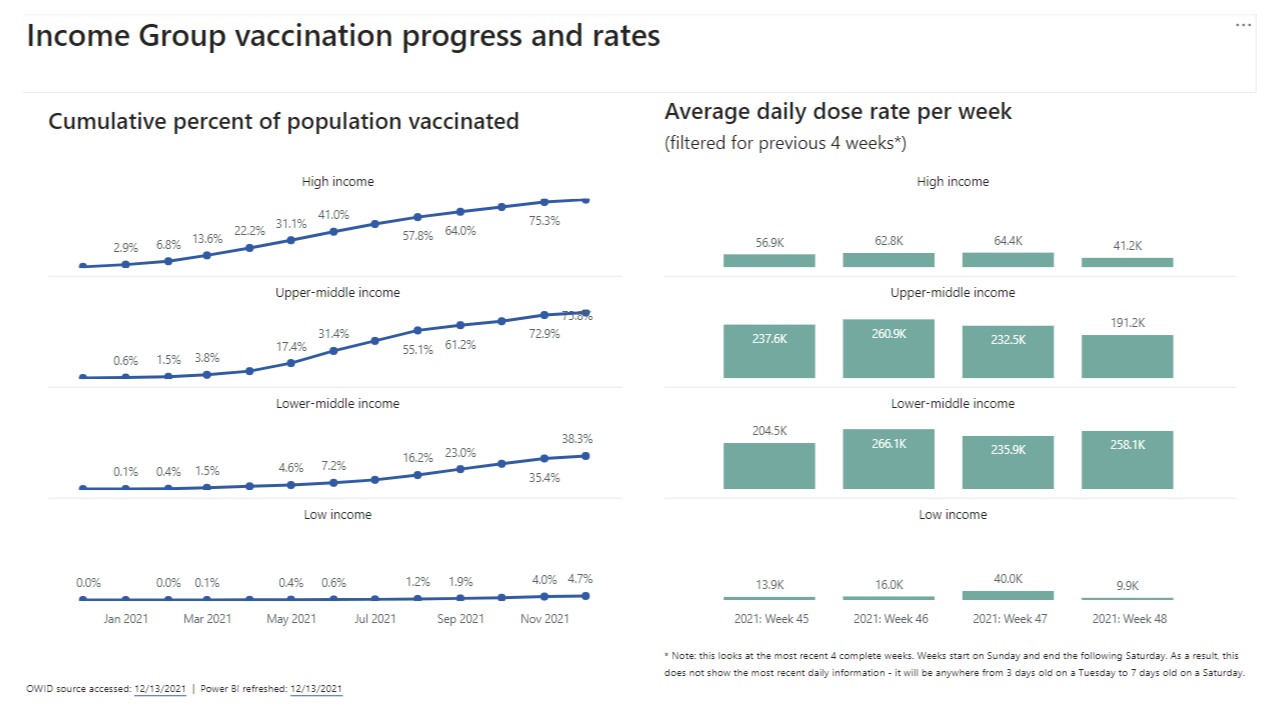
Aggregated visualizations provided insight on vaccine distribution inequity globally, representing an organizational goal to enable equitable vaccine coverage.
To meet the equitable distribution goal, the organization was targeting 30% vaccine coverage in all countries by the end of 2021. Goal-tracking visualizations showed countries reaching, on track or at-risk for meeting that goal based on vaccination rates, allowing policy teams to adjust tactics to reach goals on a country-by-country basis.
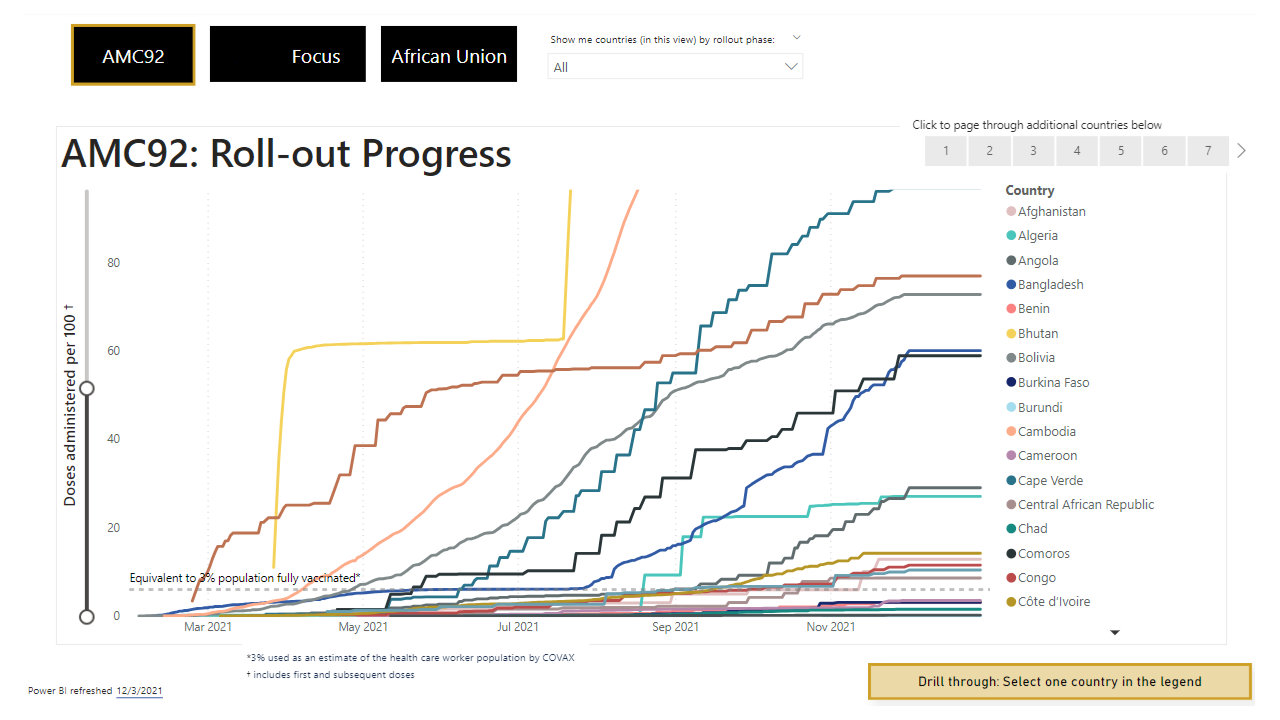
Exploratory comparative visualizations gave teams the ability to compare trends over time and track current status indicators for target cohorts of interest (African Union, AMC92, and organization priorities).
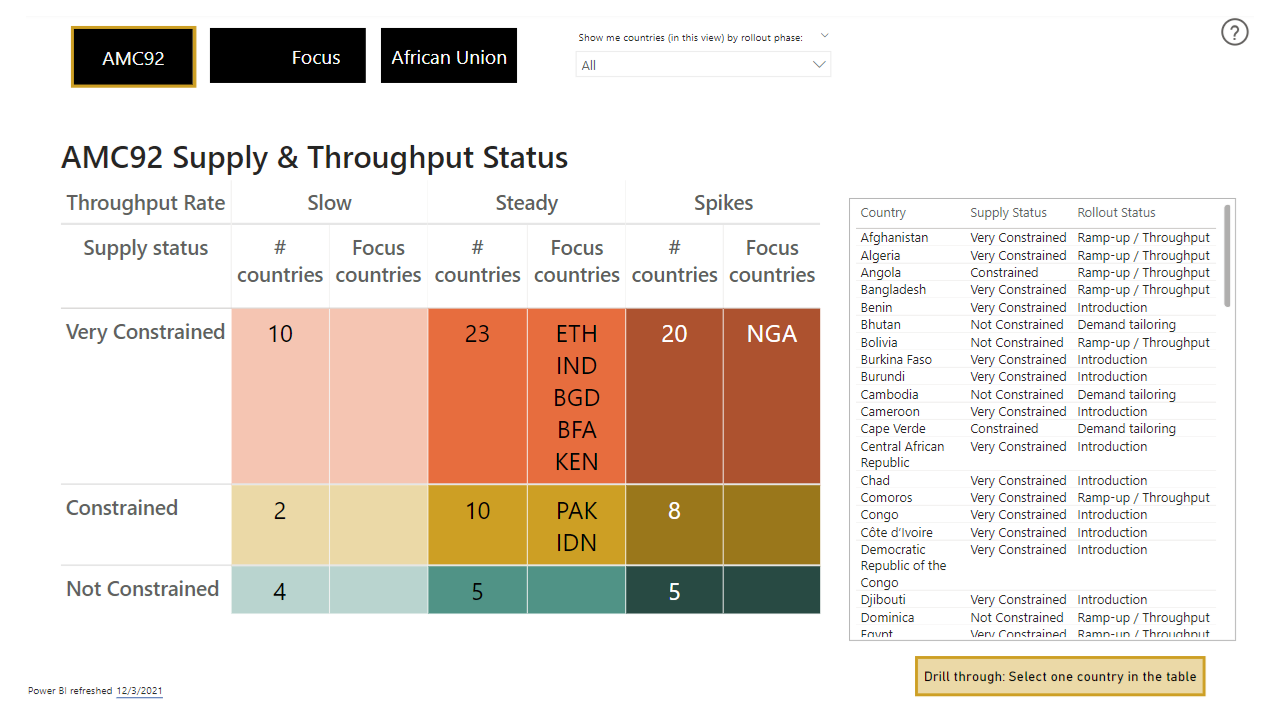
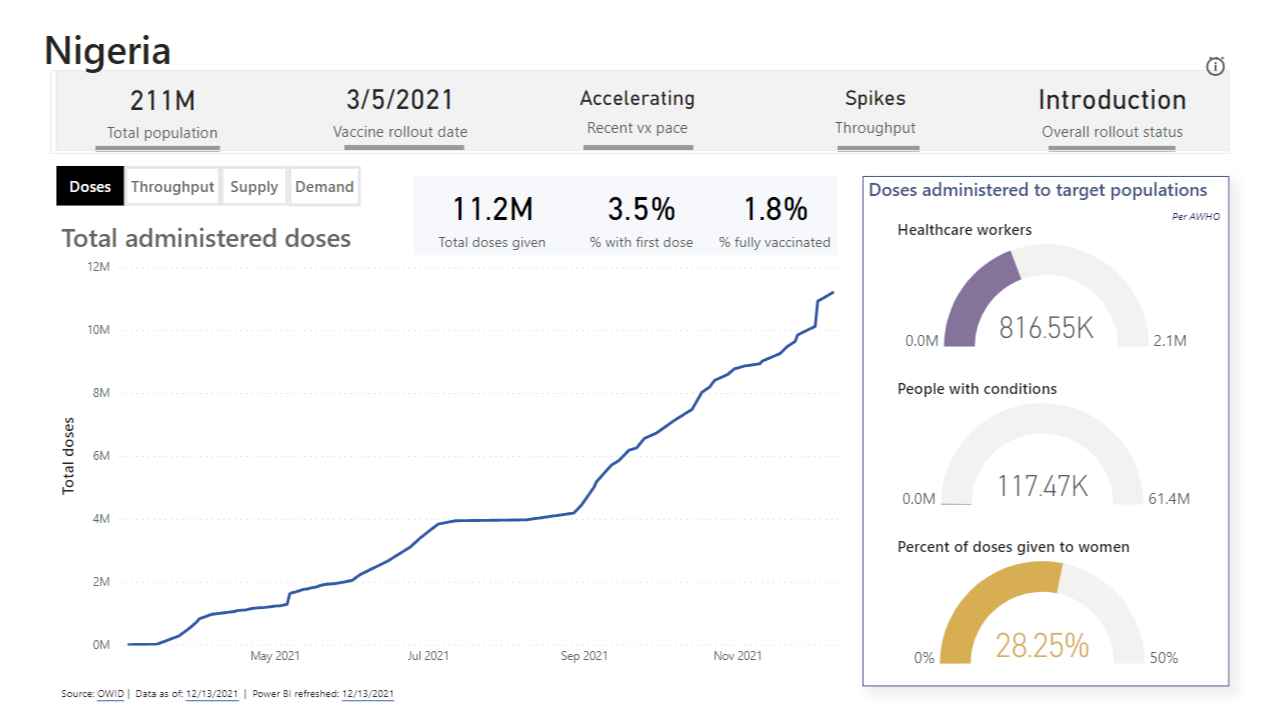
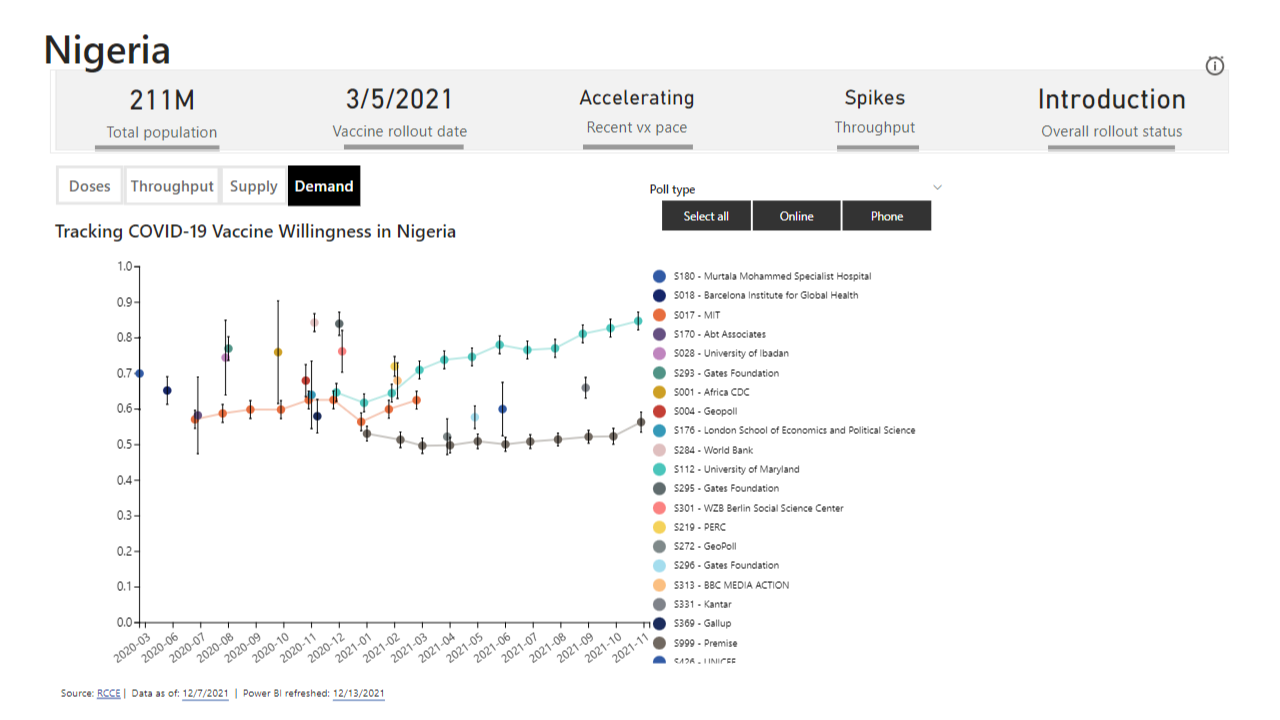
Deep Dive visualizations per country brought together data from public and private sources to summarize vaccine distribution progress in that country. Doses administered, supply, demand and throughput rates were generalized into indicators to define where each country was in the vaccine rollout lifecycle a country was on a weekly basis.
Wrangling a data model mess-terpiece
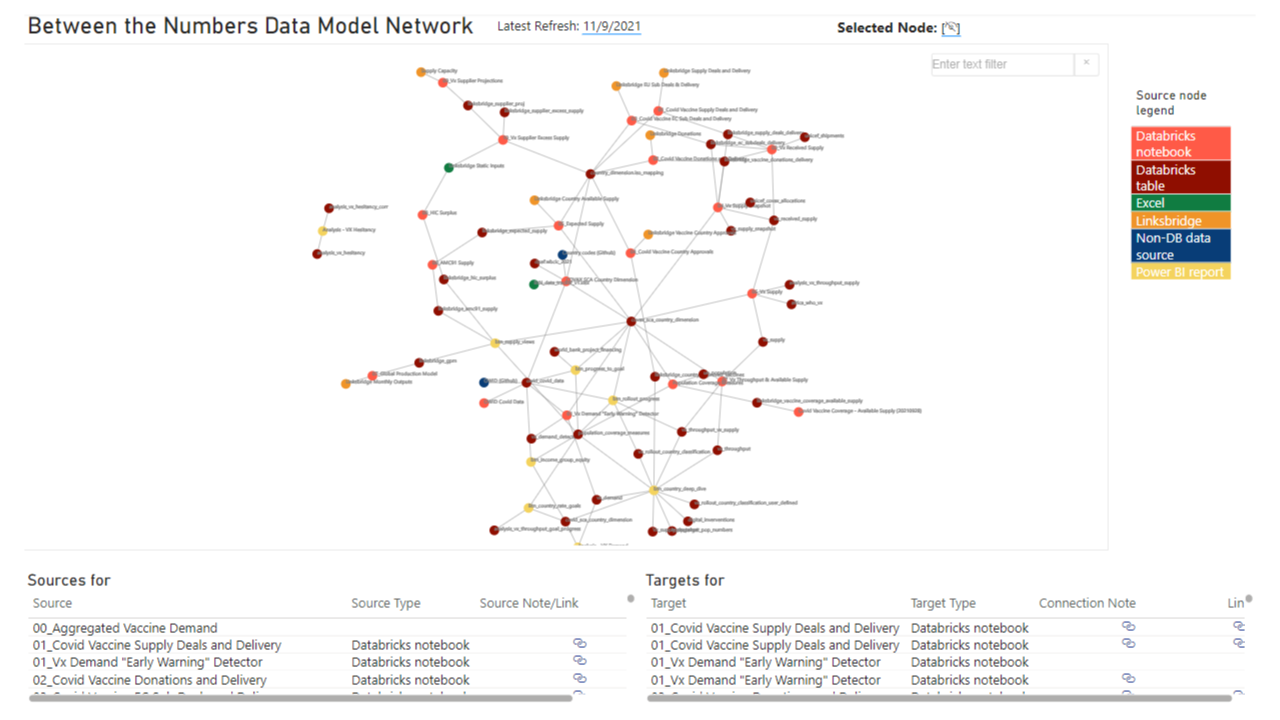
Maintaining the data model that supported these visualizations was a challenge: public sources often changed formats with little to no warning, new data was being added regularly, and the analytical modeling was consistently being refined. It was a mess that needed to be managed.
To keep this mess under control and turn it into a masterpiece, I built a lineage tracker and network diagram for all of the relationships between Databricks notebooks and the reporting suite. This allowed the technical team to complete regression testing faster after changes were made to the model, and allowed for the latest data to be available to end users within hours instead of days